SQL, Python, and Tableau basketball stats project
Recently I wanted to learn how to run SQL queries. In deciding which data to use, I wanted a dataset where I’d have some level of intuition for what the data points mean. An obvious choice is sports statistics, and basketball is the sport with which I’m most familiar.
I decided this also would be a good opportunity to further practice my python skills, particularly in object-oriented programming. I wrote a program that would simulate a basketball season in an imaginary league with 30 teams, each playing every other team twice. It would store the box score for each game in a csv file, which I could then store in an SQL database and run queries against.
Select the buttons below to reveal information for the components of the project you’d like to learn about.
I want the simulated basketball games to be as close to reality as possible, so let's look into typical game statistics using a Kaggle dataset of real NBA games. The dataset has 5 csv files: teams, players, games, games_details, and ranking. They all contain multiple columns of data, for example:
- teams.csv: founding year, mascot, arena name, owner name, etc.
- players.csv: player name, player ID, etc.
- games.csv: game date, team IDs, stats for each team, etc.
- games_details.csv: box scores for each game
- ranking.csv: team records for each season
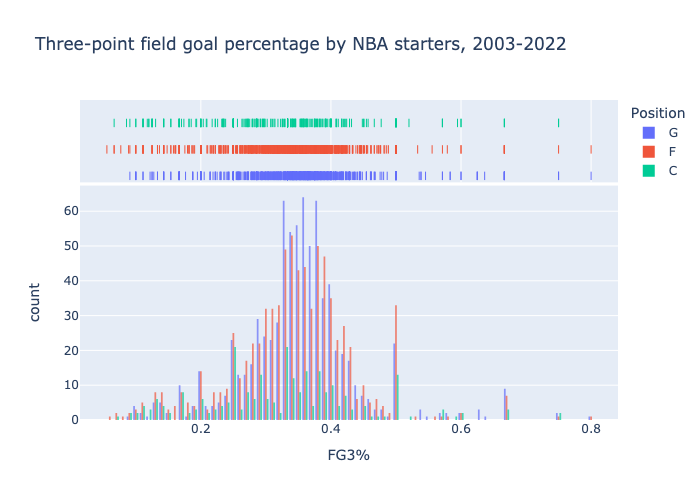
My simulated basketball league will assign to a player expected values for several of their in-game statistics, e.g. three-point field goal percentage and number of rebounds. Let's look at the career three-point field goal percentages for starting players, and plot the distribution for each of the three positions, guard (G), forward, (F), and center (C). It is quick to run an SQL query against the games_details table to get this data:
    SELECT PLAYER_ID, SUM(FG3M) AS Total_FG3M, SUM(FG3A) AS Total_FG3A
    FROM games_details
    WHERE START_POSITION = 'G'
    GROUP BY PLAYER_ID;
This query groups the starting guards by their ID, and sums the values in the columns FG3M and FG3A, returning the sums along with their ID. Only the starting players have a non-null value for START_POSITION, so the WHERE START_POSITION = 'G' line selects only the starting guards. We can do an analogous query for two-point field goals, and we can then export the data to do some exploratory data analysis in Python.
We can use pandas to manipulate the data generated by our SQL query. A processing function can filter out outliers.
    import pandas as pd

    def read_and_process_data(file_path, position, filter_col, filter_value, percent_col, numerator, denominator):
        df = pd.read_csv(file_path)
        # remove rows with 0 attempts
        df = df[df[filter_col] != filter_value]
        # add column for FG% or FG3%
        df[percent_col] = df[numerator] / df[denominator]
        # exclude outliers of 0% and 100%
        df = df[df[percent_col].between(0.01, 0.99)]
        # add column for position
        df['Position'] = position
        return df
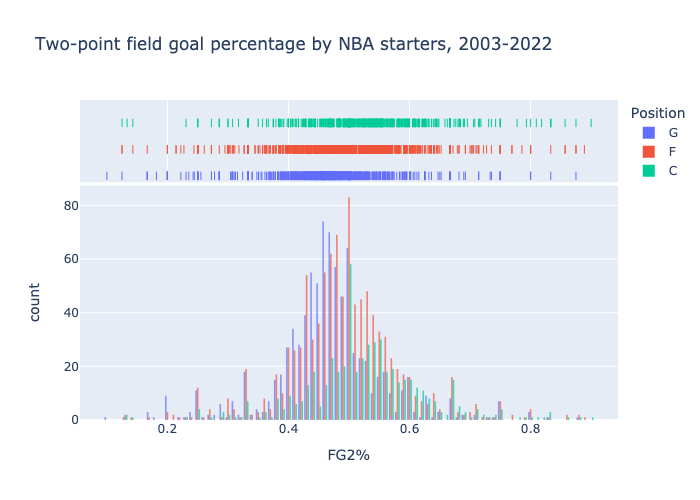
After processing the files, we generate histograms with the plotly library.
    import plotly.express as px

    # Histograms
    fg2_fig = px.histogram(fg2_data, x='FG2%', color='Position', marginal='rug', opacity=0.7, nbins=100, barmode='group')
    fg3_fig = px.histogram(fg3_data, x='FG3%', color='Position', marginal='rug', opacity=0.7, nbins=100, barmode='group')
Click on the histograms to be redirected to an interactive version where you can select/deselect different positions.
It is reasonable to say these follow a normal distribution. The means and standard deviations are:
    FG2%
    G: mean = 0.47, std = 0.09
    F: mean = 0.49, std = 0.10
    C: mean = 0.53, std = 0.10
    FG3%
    G: mean = 0.35, std = 0.09
    F: mean = 0.34, std = 0.09
    C: mean = 0.32, std = 0.12
We can use these values in our simulation when generating a player.
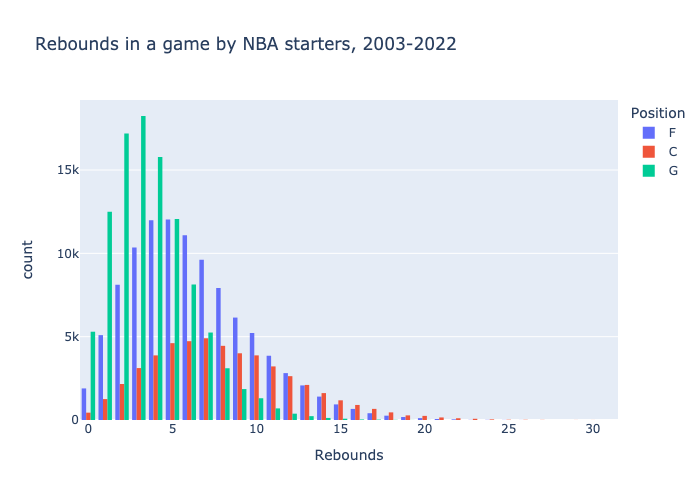
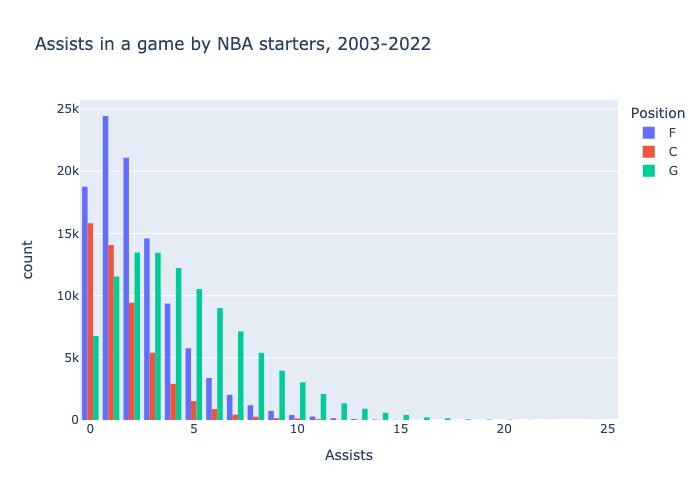
The rebounds, assists, steals, blocks, and turnovers, on the other hand, appear to follow a Poisson distribution. This makes sense, because it is reasonable to approximate that these events (i.e. rebound or assist) occur at a constant mean rate and independently of the time since the last event.
The means for these distributions are:
    G OREB 0.6941601915652641
    G DREB 3.0671553535649707
    G STL 1.1481503200899184
    G BLK 0.29137467624492985
    G TO 2.1170796070957336
    F OREB 1.4905629025794407
    F DREB 4.696712899158432
    F STL 0.9501607874185067
    F BLK 0.6708402975300316
    F TO 1.6754537723953904
    C OREB 2.494358733697034
    C DREB 5.618290608318179
    C STL 0.6815079877202245
    C BLK 1.2430730724858723
    C TO 1.595119375843257
We are now ready to write the code for our simulated league.
The python libraries used are as follows:
    import numpy as np
    import pandas as pd
    import random
    from itertools import combinations
    from math import comb
Creating the rosters
I create a class for each of the three basic positions, using the means and standard deviations (if applicable) for the distributions we investigated earlier. For example, the guard class looks like:
    class Guard(Player):
        def __init__(self, seed=None):
            super().__init__({
                # stat: (mean, std)
                'fg2': (0.47, 0.09),
                'fg3': (0.35, 0.09),
                # mean value
                'dreb': 3.07,
                'oreb': 0.69,
                'ast': 4.6,
                'stl': 1.15,
                'blk': 0.29,
                'to': 2.12
            }, seed=seed)
I then have a player class that, when called, generates a player of a particular position and gives them fixed expected values for their stats, by picking a number either according to a normal or Poisson distribution. This makes each player have some level of uniqueness to them.
    class Player:
        '''
        Generates a player of a given position and sets their expected stats.
        '''
        def __init__(self, typical_stats, seed=None):
            self.expected_stats = {}
            self.seed = seed
            means_stds = {key: value for key, value in typical_stats.items() if type(value) == tuple}
            poissons = {key: value for key, value in typical_stats.items() if type(value) == float}

            for stat, (mean, std) in means_stds.items():
                self.expected_stats[stat] = np.random.normal(mean, std, 1)[0]

            for stat, mean in poissons.items():
                self.expected_stats[stat] = np.random.poisson(mean, 1)[0]

            # create an overall rating of each player based on their expected stats
            self.overall = (self.expected_stats['fg2'] + self.expected_stats['fg3'] + self.expected_stats['dreb'] + self.expected_stats['oreb'] + self.expected_stats['ast']) / (typical_stats['fg2'][0] * typical_stats['fg3'][0] * typical_stats['dreb'] * typical_stats['oreb'] * typical_stats['ast'])
The team class initializes a team with a particular name and generates five players to be on the roster.
    class Team:
        '''
        Generates a team of 5 players.  Also sets the expected distribution of stats and the pace.
        '''
        def __init__(self, name, seed=None):
            self.name = name
            self.seed = seed
            # roster
            self.pg = Guard(seed=self.seed)
            self.sg = Guard(seed=self.seed + 1)
            self.sf = Forward(seed=self.seed)
            self.pf = Forward(seed=self.seed + 1)
            self.c = Center(seed=self.seed)

            # dictionaries with position objects
            self.positions_dict = {
                'PG': self.pg,
                'SG': self.sg,
                'SF': self.sf,
                'PF': self.pf,
                'C': self.c
            }
This class also has dictionaries that contain the expected distribution of stats by position, which are weighted according to the player's expected values for those stats. For example, for rebounds we have:
    def normalize_dict(dictionary):
        '''
        Normalize a dictionary of values so that they sum to 1.
        '''
        total = sum(dictionary.values())
        if total == 0:
            return {key: 0.2 for key in dictionary.keys()}
        return {key: value / total for key, value in dictionary.items()}

    class Team:
    '''
    Generates a team of 5 players.  Also sets the expected distribution of stats and the pace.
    '''
    def __init__(self, name, seed=None):
        self.name = name
        self.seed = seed
        # roster
        self.pg = Guard(seed=self.seed)
        self.sg = Guard(seed=self.seed + 1)
        self.sf = Forward(seed=self.seed)
        self.pf = Forward(seed=self.seed + 1)
        self.c = Center(seed=self.seed)

        # dictionaries with position objects
        self.positions_dict = {
            'PG': self.pg,
            'SG': self.sg,
            'SF': self.sf,
            'PF': self.pf,
            'C': self.c
        }

        # expected distributions of stats by position
        self.shot_distribution_pos = self.roster_weight('fg')
        self.dreb_distribution_pos = self.roster_weight('dreb')
        self.oreb_distribution_pos = self.roster_weight('oreb')
        self.ast_distribution_pos = self.roster_weight('ast')
        self.stl_distribution_pos = self.roster_weight('stl')
        self.blk_distribution_pos = self.roster_weight('blk')
        self.to_distribution_pos = self.roster_weight('to')
        # pace of team: average number of possessions per game
        self.pace = np.random.normal(75, 5, 1)[0]
        # expected rebounds a team gets per game
        self.expected_dreb = sum(player.expected_stats['dreb'] for player in self.positions_dict.values())
        self.expected_oreb = sum(player.expected_stats['oreb'] for player in self.positions_dict.values())

    def roster_weight(self, stat_to_consider):
        # returns a dictionary of weights for each position based on a given stat.
        weights_dict = {}
        if stat_to_consider == 'fg':
            for position, player in self.positions_dict.items():
                # choose the larger of 2P% and 3P%
                weights_dict[position] = max(player.expected_stats['fg2'], player.expected_stats['fg3'])
            return normalize_dict(weights_dict)
        for position, player in self.positions_dict.items():
            weights_dict[position] = player.expected_stats[stat_to_consider]
        return normalize_dict(weights_dict)
This also sets the pace for the team, which will be used later so that each simulated game does not have the same number of possessions, and the total number of expected rebounds per game.
Simulating a game
The program works by simulating a bunch of individual possessions in a game between two teams. First there are functions which handle the outcome of a shot, assist, rebound, etc. For example:
    def handle_shot(off_team, position, shot_worth, result):
        '''
        Determines if a shot is made and updates the stats accordingly.
        '''
        shot_key = 'fg2' if shot_worth == 2 else 'fg3'
        shot_chance = off_team.positions_dict[position].expected_stats[shot_key]
        if random.random() < shot_chance:
            # update points
            result[position][0] += shot_worth
            # update makes
            make_index = 4 if shot_worth == 2 else 6
            result[position][make_index] += 1
            # update attempts
            result[position][make_index + 1] += 1
            return True
        # update attempts for a miss
        miss_index = 5 if shot_worth == 2 else 7
        result[position][miss_index] += 1

    def handle_assist(off_team, shooter, result):
        '''
        Determines if an assist is made and updates the stats accordingly.
        '''
        if random.random() < ASSIST_CHANCE:
            assister = weighted_random_key(off_team.ast_distribution_pos)
            while assister == shooter:
                assister = weighted_random_key(off_team.ast_distribution_pos)
            result[assister][2] += 1

    def handle_rebound(type, team, result):
        '''
        Updates the rebounding stats.
        '''
        if type == 'oreb':
            rebounder = weighted_random_key(team.oreb_distribution_pos)
            result[rebounder][2] += 1
        else:
            rebounder = weighted_random_key(team.dreb_distribution_pos)
            result[rebounder][1] += 1
These select a player using the weighted_random_key function, which picks according to a distribution of probabilities for the players on the team. If your probability is relatively large compared to your teammates, you are more likely to be selected by the function.
    def weighted_random_key(prob_dict):
        '''
        Pick a random key from a dictionary of probabilities.
        '''
        # generate a random number
        rand_num = random.random()
        cumulative_probability = 0.0

        # iterate through the dictionary
        for key, probability in prob_dict.items():
            cumulative_probability += probability
            # check if the random number is less than the cumulative probability
            if rand_num < cumulative_probability:
                return key
We also initialize the stats for that possession with an initialize_stats function.
    def initialize_stats():
        '''
        Initializes a dictionary of stats for each position on a single possession.
        [PTS, DREB, OREB, AST, 2PM, 2PA, 3PM, 3PA, STL, BLK, TO]
        '''
        return {pos: [0] * 11 for pos in ['PG', 'SG', 'SF', 'PF', 'C']}
The possession function proceeds through a possession, calling the above functions when appropriate. It randomly selects a player from the team to take a shot; the random selection is weighted by the players' field goal percentages, i.e. if you are a better shooter, you are more likely to be the one to take the shot. The function also allows for the possibility of a turnover, and for offensive rebounds.
    def possession(off_team, def_team):
        '''
        Simulates a possession and returns the players' stats.
        '''
        # initialize who will have the ball on the next possession
        next_team = def_team
        # initialize stats for this possession
        off_result, def_result = initialize_stats(), initialize_stats()

        # check for a turnover
        if random.random() < TURNOVER_CHANCE:
            handle_steal(def_team, def_result)
            handle_turnover(off_team, off_result)
            return off_result, def_result, next_team

        # determine who will shoot the ball
        shooter = weighted_random_key(off_team.shot_distribution_pos)
        # decide whether they attempt a two or a three
        shooting_percentages = {2: off_team.positions_dict[shooter].expected_stats['fg2'], 3: off_team.positions_dict[shooter].expected_stats['fg3']}
        shooting_percentages = normalize_dict(shooting_percentages)
        shot_worth = weighted_random_key(shooting_percentages)

        # check for a made shot
        if handle_shot(off_team, shooter, shot_worth, off_result):
            handle_assist(off_team, shooter, off_result)
            return off_result, def_result, next_team

        # check for block
        handle_block(def_team, def_result)

        # check for offensive rebound
        if random.random() < OFF_REBOUND_CHANCE_BASE + OFF_REBOUND_BUFF_FACTOR * ((off_team.expected_oreb / def_team.expected_dreb) - 1):
            handle_rebound('oreb', off_team, off_result)
            next_team = off_team
        # assign defensive rebound
        else:
            handle_rebound('dreb', def_team, def_result)

        return off_result, def_result, next_team
Simulating a full game, then, simply requires us to simulate many possessions and keep track of the players' stats along the way.
    class Game:
        '''
        Simulates a game by simulating a number of possessions between two teams.
        '''
        def __init__(self, team1, team2):
            self.team1 = team1
            self.team2 = team2

        def initialize_box_score(self):
            return {pos: [0] * 11 for pos in ['PG', 'SG', 'SF', 'PF', 'C', 'Team']}

        def update_box_score(self, box_score, position_stats):
            for position, stats in position_stats.items():
                for i in range(11):
                    box_score[position][i] += stats[i]

        def sum_team_stats(self, box_score):
            for i in range(11):
                box_score['Team'][i] = sum(stats[i] for position, stats in box_score.items() if position != 'Team')

        def play_game(self):
            team1_box_score = self.initialize_box_score()
            team2_box_score = self.initialize_box_score()

            num_possessions = int(np.ceil(sum([self.team1.pace, self.team2.pace]) / 2.0))

            off_team, def_team = self.team1, self.team2
            for _ in range(num_possessions * 2):
                off_result, def_result, next_team = possession(off_team, def_team)

                if off_team == self.team1:
                    self.update_box_score(team1_box_score, off_result)
                    self.update_box_score(team2_box_score, def_result)
                else:
                    self.update_box_score(team2_box_score, off_result)
                    self.update_box_score(team1_box_score, def_result)

                off_team, def_team = next_team, self.team1 if next_team == self.team2 else self.team2

            self.sum_team_stats(team1_box_score)
            self.sum_team_stats(team2_box_score)

            return team1_box_score, team2_box_score
Simulating a season
Simulating a season is also straightforward. We enumerate all the matchups that will be played, initialize a DataFrame to store the stats for each game, and then simulate all the games. We also keep track of the winners and losers of each game so that league standings can be recorded.
    class Season:
    '''
    Simulates a season by simulating all games between all teams.  Each team plays every other team twice.
    '''
    def __init__(self, num_teams):
        self.num_teams = num_teams
        self.num_games = 2 * comb(self.num_teams, 2)
        self.teams = [Team(name=team_nicknames[i], seed=i) for i in range(self.num_teams)]
        self.matchups = self.generate_matchups()
        self.df_game_stats = self.initialize_game_stats_df()
        self.team_records = {team_name: [0, 0, 0] for team_name in team_nicknames[:self.num_teams]}

    def generate_matchups(self):
        matchups = np.array(list(combinations(self.teams, 2)))
        # flip the matchups so that each team plays each other team twice
        return np.concatenate((matchups, np.flip(matchups, axis=1)))

    def initialize_game_stats_df(self):
        columns = ['GAME_ID', 'TEAM_NAME', 'OPPONENT_NAME', 'PLAYER_NAME', 'POSITION', 'PTS', 'REB', 'AST', 'FG2M', 'FG2A', 'FG3M', 'FG3A']
        return pd.DataFrame(columns=columns)

    def add_game_stats(self, game_id, team, opponent, team_stats):
        # add the team stats for a single game to the game stats dataframe
        rows = [[game_id, team.name, opponent.name, f"{team.name}_{position}", position] + stats for position, stats in team_stats.items()]
        self.df_game_stats = pd.concat([self.df_game_stats, pd.DataFrame(rows, columns=self.df_game_stats.columns)], ignore_index=True)

    def update_team_records(self, team1, team2, team1_stats, team2_stats):
        if team1_stats['Team'][0] > team2_stats['Team'][0]:
            self.team_records[team1.name][0] += 1
            self.team_records[team2.name][1] += 1
        elif team1_stats['Team'][0] < team2_stats['Team'][0]:
            self.team_records[team1.name][1] += 1
            self.team_records[team2.name][0] += 1
        else:
            self.team_records[team1.name][2] += 1
            self.team_records[team2.name][2] += 1

    def play_season(self):
        for game_id in range(self.num_games):
            team1, team2 = self.matchups[game_id]
            team1_stats, team2_stats = Game(team1, team2).play_game()
            self.add_game_stats(game_id, team1, team2, team1_stats)
            self.add_game_stats(game_id, team2, team1, team2_stats)
            self.update_team_records(team1, team2, team1_stats, team2_stats)

        self.team_records = {key: value for key, value in sorted(self.team_records.items(), key=lambda item: item[1][0], reverse=True)}
For a league with 50 teams, we can then simply run:
    s = Season(50)
    s.play_season()
The box score data is now ready for analysis. I uploaded the csv-file output from my Python simulation to a MySQL server hosted on an Amazon Web Servcies RDS instance, and used the free software DBeaver to interact with the server.
Suppose we want to calculate a fantasy score for each player in each game. We can alter the SQL table with the following sequence of commands to do so.
    ALTER TABLE game_stats
    ADD fantasy_score INT;
    UPDATE game_stats
    SET fantasy_score = PTS + FG3M - FG2A - FG3A + 2*FG2M + 2*FG3M + OREB + DREB + 2*AST + 4*STL + 4*BLK - 2*`TO`;
We might want to plot a rolling average of a player's fantasy score as the season progresses. To do this, we can make use of a common table expression (CTE) to remove the 'Team' stats from the calculation.
    WITH FantasyScores AS (
        SELECT GAME_ID, GAME_DATE, PLAYER_ID, fantasy_score
        FROM game_stats
        WHERE `POSITION` != 'Team'
    ),
    SELECT GAME_DATE, PLAYER_ID,
        AVG(fantasy_score) OVER (
            PARTITION BY PLAYER_ID
            ORDER BY GAME_DATE
            ROWS BETWEEN UNBOUNDED PRECEDING AND CURRENT ROW
        )
    FROM FantasyScores
We can also add a column of data to each row in the game_stats table that indicates whether that player won or lost the game. This is something that could have been done in Python, but I didn't realize I'd want it until after I uploaded the data to the SQL server. The process makes use of CTEs and the joining of tables.
    WITH
    TeamPoints AS (
        SELECT GAME_ID, TEAM_ID, SUM(PTS) AS PointsFor
        FROM game_stats
        WHERE `POSITION` != 'Team'
        GROUP BY GAME_ID, TEAM_ID
    ),
    TotalPoints AS (
        SELECT GAME_ID, SUM(PTS) AS PointsForPlusPointsAgainst
        FROM game_stats
        WHERE `POSITION` != 'Team'
        GROUP BY GAME_ID
    ),
    JoinedTables AS (
        SELECT a.GAME_ID AS GAME_ID, a.TEAM_ID AS TEAM_ID, a.PointsFor AS PointsFor, b.PointsForPlusPointsAgainst AS PointsForPlusPointsAgainst
        FROM TeamPoints AS a
        INNER JOIN TotalPoints AS b ON a.GAME_ID = b.GAME_ID
    ),
    WLDTable AS
    (
        SELECT GAME_ID, TEAM_ID, PointsFor, PointsForPlusPointsAgainst,
            CASE
                WHEN PointsFor > PointsForPlusPointsAgainst / 2 THEN 1
                WHEN PointsFor < PointsForPlusPointsAgainst / 2 THEN 0
                WHEN PointsFor = PointsForPlusPointsAgainst / 2 THEN 2
            END AS WLD
        FROM JoinedTables
    )
    UPDATE game_stats gs
    JOIN WLDTable wld ON gs.GAME_ID = wld.GAME_ID AND gs.TEAM_ID = wld.TEAM_ID
    SET gs.WLD = wld.WLD;
Check out the Tableau story I created with the data resulting from my Python simulation.


